Price Action is Significant with Any Trading Instrument
The most important technical tool a trader can have, without a doubt, is the ability to correctly understand and interpret price. In classical technical analysis there are two types of indicators: lagging and leading. The ultimate leading indicator is price itself. In this special 3 part report, we will: 1. Break down the fundamental elements of price action 2. Analyze charts in order to see it clearly 3. Discuss how to build a trading methodology around an understanding of price action
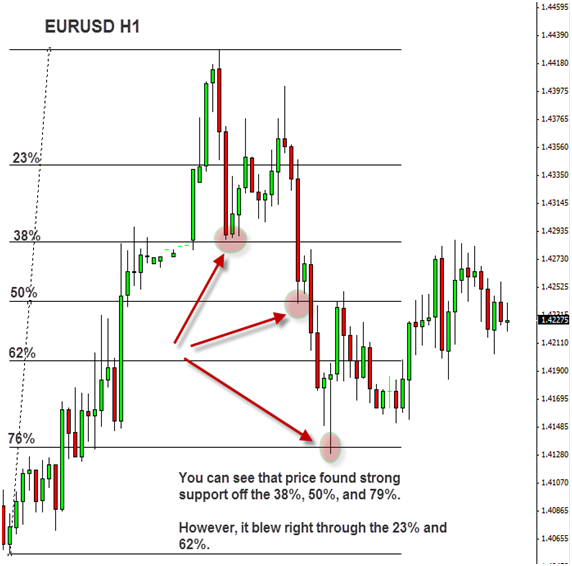
Fundamental Elements of Price Action
In order to understand price action and how it moves, one must first recognize the force behind price. Humans are the fundamental driving force behind price. This is referred to as behavioral finance. The interesting thing about humans is they tend to do things in patterns—repeatable patterns. And this is how price moves. Price continually moves in repeatable patterns. When a new trader begins to look at charts for the first time it can be quite overwhelming. In fact, it appears to be quite chaotic at first glance.
However, a trained eye does not see chaos at all. In fact, a trained eye sees a degree of order in the apparent chaos. There is an ebb and flow to human behavior, and that ebb and flow is graphically represented on every chart of every instrument that has ever been traded in the history of financial markets. And that is the beauty of embarking on the incredible journey to becoming a master of price action. Price action applies to all financial markets, so not matter whether one is trading currencies, commodities, or equities, if one begins to see price and its true movements, one will have an edge in any market he or she chooses to trade. So the first lesson is to understand there is actually order within the apparent chaos.
We will soon uncover the basics of price action, but first one must understand how to develop an eye to see this order. In parts 2 and 3 of this Special Report, there will be several graphic representations of price and it will be clear in these examples, how it moves, but in order for a trader to see and understand the movement of price in real-time market action, one must spend countless hours observing price. There is no substitute for time. I will share the characteristics and movements of price with you, but you must watch price move time and time and time again on a chart in real-time market action in order to really understand and see it for yourself.
In Malcolm Gladwell’s book, Outliers, he discusses that it takes no less than 10,000 hours of concentrated practice to reach a level of world-class talent in a skill. That amounts to 40 hours per week for 5 years. One can definitely understand the basics of price action rather quickly, but a true mastery takes time. It may or it may not take 10,000 hours, but it does indeed take time. Be patient. As you begin to understand the concepts shared in Parts 2 and 3, take time to simply watch price every day, and notice how it moves. Make sure you read our second part on Price Action Don’t forget to take a sneak peak of our Oracle Trader review which is launching this month.