Let’s get down to the specifics of how price moves. First, remember from Part 1 that price moves within patterns. Although it appears that price moves in a rather unpredictable, chaotic manner, a trained eye can see that it moves in patterns. These patterns are referred to as fractals. Although a fractal is a very involved and complicated geometric pattern, it can basically be defined as a pattern within a pattern, or a micro-pattern. This is how price moves—in micro patterns.
Let’s take a look at a chart.
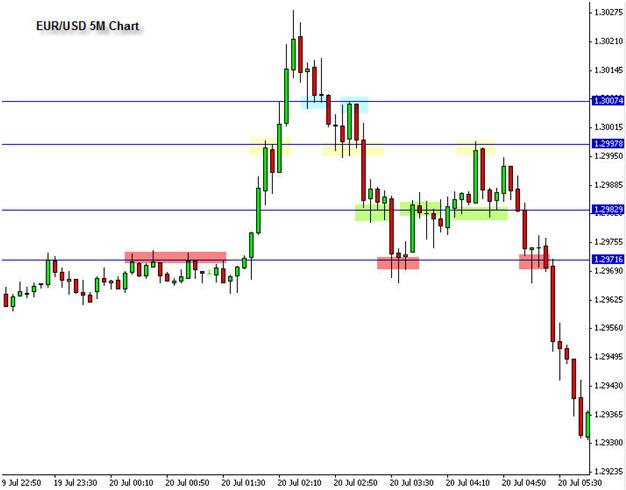
Forex Price Action
Study the above chart and notice that price continually moves in an ebb and flow between these shaded boxes. This is a 5 minute chart, but price moves in this behavioral manner on all time frames. Let’s use the red shaded boxes as an example for our discussion. At red shaded box 1, price is finding resistance to the upside at 1.2971. Finally, price makes a nice clean break above the 2971 level. When price makes a clean break of resistance like this, you can be most assured that when price eventually comes back to that level later, it will now act as support. This is because of the human behavioral tendencies behind price.
And, of course, at red shaded box 2 this is exactly what happens. Price break up for a 50 pip move above the 2970 level, and then when if finally comes back down several hours later, the 2971 area now acts as support. If a trader would have entered the market long at 2970, he would have been up +28 pips after about an hour. This is how price moves again and again. You can see it all over this chart above. Using the Forex profit multiplier is all based on price action.
Take a look at the 1.2997 area, which is the blue line with the yellow shaded boxes. As price rises to the 2997 level the first time, it finds resistance at yellow shaded box 3. Then, after a few minutes it finally breaks to the upside. About an hour later, price revisits this level at box 4, and it now acts as support. Then, price eventually moves down lower for several hours and then rises to the 2971 level again at yellow shaded box 5 and, what do you, it acts as support again. This is how price moves.
Begin to simply sit down and watch price move on a 5 minute and 15 minute chart and notice how it continually stalls and bounces off of these levels. This is the natural ebb and flow of price action. Once you apply yourself to seeing this movement of price in the chart, you will eventually start to see exactly where price will always stall. But that is the easy part. The harder part is being able to identify which levels will actually hold long enough to give you a good payout of pips.
You don’t want to take trades at levels that will just hold price for a few minutes and offer maybe 5 pips. You want to find the levels that are going to offer good reversals, where price may move 10, 20, or 30+ pips. In Part 3 of this Special Report, we will begin to break down how we can build a trading methodology around this simple understanding of price. Make sure you read our first part on Price Action