Stop Buying Supply and Selling Demand!
As we discussed in the last article, understanding the dynamics of supply and demand in the market can bring a revolution to your trading. In this article, we will discuss how to implement this new understanding of supply and demand in order to give you an edge in your trading approach. Remember, in order to consistently make money in the market, you must know what your edge is and be able to define it.
One of the most common traits of losing traders is not understanding this basic idea of supply and demand in the marketplace. Most losing traders are unknowingly buying supply and selling demand. Read that last sentence again.
Trading is a game of probability. When you take a trade, you will never be guaranteed that price is going to move in your direction. However, if you have an edge and have done an adequate amount of analysis and are trading intelligently, you may enter a position knowing that the odds are in your favor that price will move in your direction. Sure, it may move against you and trigger your stop loss, but you know that more often than not, it is going to move in your direction and you are going to get paid.
The primary way to stack the odds in your favor is by selling supply in the market and buying demand. Most struggling traders do not understand how to recognize these areas of supply and demand in the market. Your goal should be to find these zones of supply and demand in the marketplace, and then with your trading strategy, take positions around these areas.
For example, if you have identified a particular area on a chart as an area of supply, then you do not want to be buying in that area. Conversely, if you have identified an area of demand, you don’t want to be selling in that area. If you go with the market flow like this—buying at demand and selling at supply—you will dramatically increase your winning percentage, and as you see this truth work in action, you will develop an increased confidence in your trading ability and in your strategy, which is absolutely essential to being a consistently, profitable trader.
Market Edge
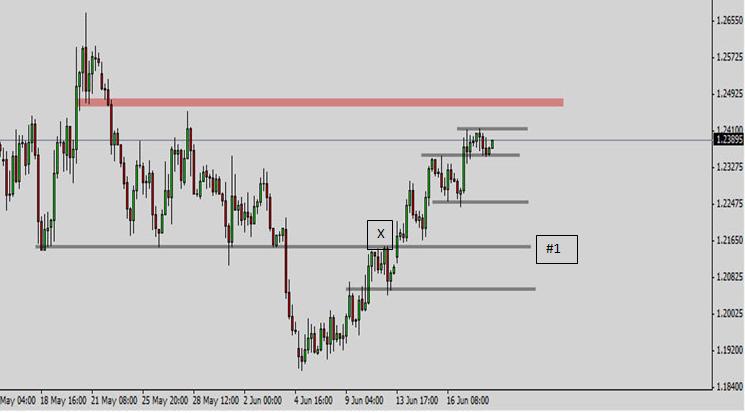
This chart is a 1 Hour Chart of the EUR/USD. The black shaded areas are areas of supply and demand in the market. You want to learn to identify these areas on your charts. Where has price stalled in the past? This is the question to ask. You want to identify zones on your chart where price has found support or resistance.
The basic mantra of support and resistance trading is that if you have an area of support or demand in the market and price is finally able to break below it, then this area that once acted as demand and support will now act as resistance or supply. Understanding this one simple truth is powerful enough to dramatically increase your winning percentage as a trader. Take a look at the chart at the very long black line numbered, #1. This line acted as support from May 18th through June 3rd. Then finally on June 4th sellers were able to push the market lower. Once a major line of support like this is broken, this area will now acted as resistance the next time price visits this area. The reason is simple.
The reason price was finally able to move below black line #1 was because a massive amount of sellers came into the market. All of those sell orders are camped right at line #1. In the future, when price makes its way back up to this level, it will most likely bounce short again because of all the sell orders camped at this level. The sellers who initially broke through this black line #1, will probably be able to fend off the initial fight to break through this line to the upside in the future.
And sure enough, we can see where price finally came back up to that area on June 11th at the X. The sellers were indeed able to fend off the initial push by buyers. If you had sold at resistance at the black line #1 on June 11th, you would have been able to pocket over 100 pips on the move.