Supply & Demand in the FX Market
The basis of free market economic theory is the truth that supply and demand determine the price of goods and services. For example, if Joe has a new product he wants to sell, how does he determine how much to sell it for? Well, he can do lots of marketing research on his competition and determine what a fair initial price would be, but ultimately his price is going to be determined by the market. If lots of folks are buying his new gizmo, then Joe can raise the price. On the other hand, if no one is buying his gizmo, he can drop the price, in hopes of luring in prospective buyers.
This economic truth dominates free markets and the largest free marketplace in the entire world is the FX Market. What rules the FX Market? How are currency prices set? By supply and demand.
When you begin to see currency prices in this light, it really can bring a revolution to your perspective and understanding of the marketplace. Let’s take a look at a chart.
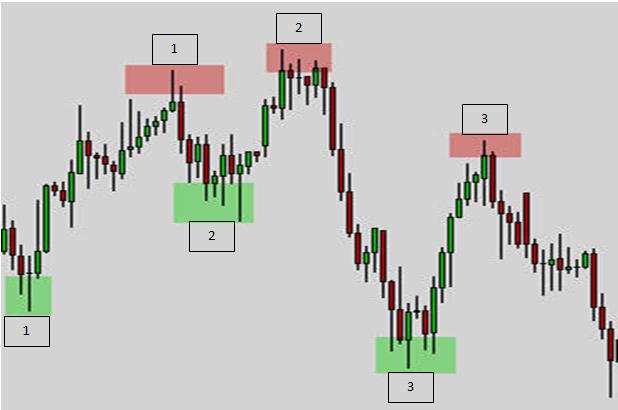
Every time you look at an FX Chart (or any chart for that matter), there is a story being told before your eyes. The two main characters in that story are Supply and Demand. In the above chart, the green areas are zones where demand came into the marketplace and caused buyers to bid up the price for this currency pair, and the red zones are areas where excess supply came into the market and caused buyers to weaken and sellers to push down the price for this currency pair.
At the green box #1, buyers saw the pair as cheap and at a good price, so they bought. Eventually, price rose to the red box #1 and at this point, buyers suddenly started to see the price as too expensive. Here there is all of a sudden too much supply in the market. There is more of this currency pair than there are buyers who want to purchase it, so the excess supply causes sellers to push the price down.
Sellers take control of the market and price is pushed down to green box #2. At this point a gridlock begins to form. Sellers are pushing it lower, but buyers are meeting them head on. Sellers can’t push it any lower, but buyers can’t really push it any higher, either. There is a battle going on between buyers and sellers. Eventually, either buyers or sellers will give up and price will continue in one direction. In this example, buyers are finally able to take control and push the price up to red box #2. At this point, there is once again an excess of supply in the market and sellers push prices all the way down to green box #3.
At red box #3, there is once again a battle between buyers and sellers that ensues for several candlesticks before sellers give up and buyers are able to push prices up to red box #3.