Fast Economic News

Fast Economic News

Fast Economic News (www.fasteconomicnews.com) is more than a site devoted to getting you the most up to date information regarding financial markets. When you are trading, you want the most relevant and important news as quickly as possible. Not only will this allow you to make informed trading decisions, you will have a more solid timeframe of when trades should take place and in what direction they should be going. Also known as sentiment trading, this has proven to be a powerful trading strategy, regardless of the trader’s skill level.

Fast Economic News has different levels of service based upon their clients’ needs. Their most basic package, “Just the News,” will give you instantaneous access to news as it happens. This program targets professional traders who do not rely on news for making their trading decisions. At only $9.95 per month, it is hard to pass up an option like this one, especially if you do not require someone to interpret news data for you.

News Trading with Help
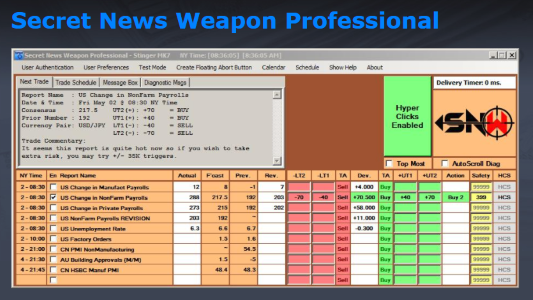
Other options include the “Secret New Weapon Lite,” “Secret News Weapon Professional,” and “Secret News Weapon Elite.” These products vary in the way that news is acted upon. For example, the “Lite” option is designed to not overwhelm the newbie news trader while showing them the methodology that will turn them into a professional trader. The “Professional” option has news reports filed away that you can access with just the click of a button. You can also trade the news automatically with this option if you wish. The “Elite” version has everything the news trader could ever wish for. This delivers over 400 news reports per month and enables the fastest automatic trading that this site has to offer.

If you are looking for a new way to trade, this site might be just what you are looking for. News trading has grown immensely in popularity as people see how effective it really is. Don’t let your chance to make more money in the market slip away.

***Your capital may be at risk. This material is not investment advice.***

AVATrade

AVATrade

AvaTrade has been a major force in the world of Forex trading since it was founded in 2006. Today, there are many clients from around the world that use this site, and for a good reason. This is one of the most competitive brokers out there. If you’re looking for a broker, this is one of the ones you should be considering from the beginning. But just because it’s right for some people doesn’t mean it’s right for everyone.

So, keep reading if you’re interested in learning whether AvaTrade is the right Forex broker for you and your needs.

What Do They Offer?

AvaTrade has a lot to offer their clients. They offer a wide variety of currency pairs to trade, including the euro, the U.S. dollar , and much much more. AvaTrade does offer Contract for Difference, if this is something that you’re interested in trading. They offer these in commodities, and stocks. Metal, stock, and bond trading is also available through this broker.

Do They Accept U.S. Based Traders?

No. AvaTrade currently does not allow those within the U.S. to use their services. Their many offices are based out of Ireland, and they are a regulated broker, but they are not accepting those from the U.S. now. You need to live in a country where they are allowed, such as Australia, the United Kingdom, or Japan, just to name a few.

Customer Support

No one ever wants to need to rely on customer support, but if you do have an issue, you want to know that your questions will be answered quickly and effectively. AvaTrade has a 24 hour customer support service line set up, and they have a quick turnaround on responding to emails, phone calls, and direct messages. If you have questions about creating an account, closing an account, or anything in between, their customer support team is there to help you.

Opening an Account

You can open an account with AvaTrade with as little as $100 USD. They also offer the euro, the British pound sterling, and the Australian dollar for you to open up accounts with. They do offer a few other deposit currencies, but using one of the ones listed above will give you more flexibility with your account, including an ability to get deposits and rebates back on your cash.

You have a variety of options open to you when it comes to funding your account. You can use a wire transfer directly from your bank account, a credit card, or a variety of e-wallets. These include Skrill, PayPal, Neteller, and Webmoney.

Bonuses?

In some markets, the deposit bonus is disappearing. That is not the case with AvaTrade. If you use one of their major base currencies (see above), you are eligible for a bonus. The amount of your bonus depends on how much you deposit. They can range from $35 to $14,000. The more you deposit, the larger your bonus will be. These are mostly applied to just your initial deposit, but there are a handful of bonus opportunities that will arise here and there. Pay attention to when these occur so that you can maximize your account’s ability to make money for you.

Trading

We recommend using the MetaTrader platform to make your trades through AvaTrade. MT is universally recognized as one of the most powerful trading tools out there when it comes to the Forex market. When you use this, you have the opportunity to not just make trades, but to set alerts for yourself, create stop-loss points, trigger future trades, and you gain access to a huge array of technical analysis tools to ensure that you are making the best decisions you can possibly make.

Using MT also allows you to set up Expert Advisors and utilize trading robots, if you desire to go this route. These are advanced tools, but many traders like to use them to help supplement their trading and relieve some of the pressure that comes with Forex trading by automating some or all of the steps involved.

Spreads will vary based upon your leverage, the time, your account type, and the pair that you’re trading. To give you an idea of what this looks like, the average spread on the EUR/USD will vary from 1.0 to 1.9 pips. Being able to minimize your spread will help you a lot over the long run. It might be a fraction of a penny here and there, but as you trade more and at higher volumes, these fractions can add up to thousands of dollars.

The maximum amount of leverage that you can utilize is 400 times your base amount. Be sure to follow all of the applicable safety and money management rules so that you are protecting your capital and minimizing risk while also maximizing profit rates.

***Your capital may be at risk. This material is not investment advice.***
Understanding Price Action Part Two

Understanding Price Action Part Two

Let’s get down to the specifics of how price moves. First, remember from Part 1 that price moves within patterns. Although it appears that price moves in a rather unpredictable, chaotic manner, a trained eye can see that it moves in patterns. These patterns are referred to as fractals. Although a fractal is a very involved and complicated geometric pattern, it can basically be defined as a pattern within a pattern, or a micro-pattern. This is how price moves—in micro patterns.

Let’s take a look at a chart.

Forex Price Action
Study the above chart and notice that price continually moves in an ebb and flow between these shaded boxes. This is a 5 minute chart, but price moves in this behavioral manner on all time frames. Let’s use the red shaded boxes as an example for our discussion. At red shaded box 1, price is finding resistance to the upside at 1.2971. Finally, price makes a nice clean break above the 2971 level. When price makes a clean break of resistance like this, you can be most assured that when price eventually comes back to that level later, it will now act as support. This is because of the human behavioral tendencies behind price.

And, of course, at red shaded box 2 this is exactly what happens. Price break up for a 50 pip move above the 2970 level, and then when if finally comes back down several hours later, the 2971 area now acts as support. If a trader would have entered the market long at 2970, he would have been up +28 pips after about an hour. This is how price moves again and again. You can see it all over this chart above. Using the Forex profit multiplier is all based on price action.

Take a look at the 1.2997 area, which is the blue line with the yellow shaded boxes. As price rises to the 2997 level the first time, it finds resistance at yellow shaded box 3. Then, after a few minutes it finally breaks to the upside. About an hour later, price revisits this level at box 4, and it now acts as support. Then, price eventually moves down lower for several hours and then rises to the 2971 level again at yellow shaded box 5 and, what do you, it acts as support again. This is how price moves.

Begin to simply sit down and watch price move on a 5 minute and 15 minute chart and notice how it continually stalls and bounces off of these levels. This is the natural ebb and flow of price action. Once you apply yourself to seeing this movement of price in the chart, you will eventually start to see exactly where price will always stall. But that is the easy part. The harder part is being able to identify which levels will actually hold long enough to give you a good payout of pips.

You don’t want to take trades at levels that will just hold price for a few minutes and offer maybe 5 pips. You want to find the levels that are going to offer good reversals, where price may move 10, 20, or 30+ pips. In Part 3 of this Special Report, we will begin to break down how we can build a trading methodology around this simple understanding of price. Make sure you read our first part on Price Action

***Your capital may be at risk. This material is not investment advice.***

Understanding Price Action Part One

Understanding Price Action Part One

Price Action is Significant with Any Trading Instrument

The most important technical tool a trader can have, without a doubt, is the ability to correctly understand and interpret price. In classical technical analysis there are two types of indicators: lagging and leading. The ultimate leading indicator is price itself. In this special 3 part report, we will: 1. Break down the fundamental elements of price action 2. Analyze charts in order to see it clearly 3. Discuss how to build a trading methodology around an understanding of price action

Fundamental Elements of Price Action
In order to understand price action and how it moves, one must first recognize the force behind price. Humans are the fundamental driving force behind price. This is referred to as behavioral finance. The interesting thing about humans is they tend to do things in patterns—repeatable patterns. And this is how price moves. Price continually moves in repeatable patterns. When a new trader begins to look at charts for the first time it can be quite overwhelming. In fact, it appears to be quite chaotic at first glance.

However, a trained eye does not see chaos at all. In fact, a trained eye sees a degree of order in the apparent chaos. There is an ebb and flow to human behavior, and that ebb and flow is graphically represented on every chart of every instrument that has ever been traded in the history of financial markets. And that is the beauty of embarking on the incredible journey to becoming a master of price action. Price action applies to all financial markets, so not matter whether one is trading currencies, commodities, or equities, if one begins to see price and its true movements, one will have an edge in any market he or she chooses to trade. So the first lesson is to understand there is actually order within the apparent chaos.

We will soon uncover the basics of price action, but first one must understand how to develop an eye to see this order. In parts 2 and 3 of this Special Report, there will be several graphic representations of price and it will be clear in these examples, how it moves, but in order for a trader to see and understand the movement of price in real-time market action, one must spend countless hours observing price. There is no substitute for time. I will share the characteristics and movements of price with you, but you must watch price move time and time and time again on a chart in real-time market action in order to really understand and see it for yourself.

In Malcolm Gladwell’s book, Outliers, he discusses that it takes no less than 10,000 hours of concentrated practice to reach a level of world-class talent in a skill. That amounts to 40 hours per week for 5 years. One can definitely understand the basics of price action rather quickly, but a true mastery takes time. It may or it may not take 10,000 hours, but it does indeed take time. Be patient. As you begin to understand the concepts shared in Parts 2 and 3, take time to simply watch price every day, and notice how it moves. Make sure you read our second part on Price Action Don’t forget to take a sneak peak of our Oracle Trader review which is launching this month.

***Your capital may be at risk. This material is not investment advice.***

Black Mamba Forex

Black Mamba Forex

Using the Black Mamba as a Sidekick
The words “Black Mamba” may be bring one of two images to your mind. First, if you are a basketball fan, it brings to mind the ferociously talented Kobe Bryant, as he is nicknamed the Black Mamba. Second, it may bring to mind an image of the most deadly snake in Africa. Although I do love basketball, and consider Kobe Bryant to be one of the All-Time Greats, this FX Strategy is so named because it shares some key characteristics with the Black Mamba, Africa’s most deadly snake.

The Black Mamba is a poisonous snake in Africa that hunts its prey by hiding and waiting for it to get within striking distance. When its unknowing prey falls within striking distance, the Black Mamba goes to work. This is exactly how we pursue our trade set-ups as traders of the Black Mamba Strategy.

Let’s get to it. Currency pairs do not move an infinite amount of pips per day. In fact, they actually move in a rather predictable pattern. Under normal market conditions, the EUR/USD generally moves about 130 pips. That can increase or decrease depending on certain fundamental drivers, but for the most case, the E/U will generally move that amount.
The aim of this trading strategy is to locate the zone where a currency pair will be exhausting its daily range and then determine whether there are any key levels in those areas that may offer us a high probability reversal point.
The True Black Mamba

Stealth Trading Style
Technically, this is considered a contrarian market approach, since you will be fading market momentum. It is also termed a “reversion to mean” strategy, which statistically is a strategy that is profitable over the long term.

The preparation for this strategy ideally takes place each night between 7-8 pm. At 7 pm est, you want to look at price and measure X amount of pips in each direction, with X being your daily range. I like to calculate the daily range by taking the average over the previous 10 trading days. This will help you stay in alignment with current market conditions instead of simply sticking to a fixed number which could change over time as market conditions change. To find the average, you can either program it in any of the various trading platforms that have learn-able programming language, or you can do it by hand. Mark 7 pm est on your chart for each of the previous 10 trading days and determine how many pips that pair moved each day. Then take the total divided by 10, and voila you have your daily range.

Let’s assume the range is 150 pips for the pair you are looking at. Sometime during the Asian session, draw a horizontal line 150 pips in each direction from the opening price at 7 pm. These 2 lines are the zones where you will now look for a key level of reversal.

The reason I take 7 pm est is because that is the beginning of the new day in London, and London times are what the majority of traders around the world are looking at. Here is an example below.
Playing the Black Mamba
Black Mamba Forex Trading Strategy
Now, you are going to look for key levels within or close to those red boxes where price may offer a reversal.

***Your capital may be at risk. This material is not investment advice.***